Synthetic Platelets Put the Brakes on Blood Loss
In animals, they cut bleeding time in half, but use in humans is still far off
By Ed EdelsonHealthDay Reporter
WEDNESDAY, Dec. 16 (HealthDay News) -- Hoping to improve on nature, researchers have built and tested synthetic versions of the blood-clotting cells called platelets, to be used in trauma or other cases where blood just won't stop flowing.
dblclick('xxlA');
"We start by making a core, with material that is used in degradable stitches, which dissolve in the body," said Erin B. Lavik, a professor of biomedical engineering at Case Western Reserve University, and lead author of a report published Dec. 16 in Science Translational Medicine. "Then we attach a polymer that is soluble in water and is used in the pharmaceutical industry. Then we attach a molecule that interacts with activated platelets and helps them clot more quickly."
The hope is that the artificial platelets can replace or augment the activity of the currently used clotting medication, known as factor VIIa, Lavik explained.
Factor VIIa is a protein that plays a central role in blood clotting. A genetically engineered version of the protein is now available for medical use. It was introduced for use in people with hemophilia, a genetic condition in which normal clotting does not occur, and it is being increasingly used against uncontrollable hemorrhage.
But factor VIIa must be kept in refrigerated form and has a short shelf life, Lavik said. And it cannot be used for head or spinal cord injuries, for fear of complications.
"The reason we developed this synthetic platelet is that it is stable at all temperatures," Lavik said. "It is a fine powder that can be administered intravenously. The faster you can control bleeding, the better the outcome."
In animal tests, injured rats given injections of the artificial platelets stopped bleeding in half the time of those that went untreated. Rats that got injections 20 seconds after an injury stopped bleeding in 23 percent less time than untreated rats.
"We also did head-to-head comparisons with factor VIIa," Lavik said. "When the artificial platelets were introduced, bleeding was reduced even more." The artificial platelets induced clotting 25 percent faster than factor VIIa, the report said.
However, a long series of tests lie ahead before the artificial platelets can enter routine medical practice, Lavik said. "The next step would be an animal model that most closely mimics human injury," she said. "We have to move up to larger animals. Pigs are most commonly used."
Financial help is also needed. "We have applied to federal and non-federal groups for funding," Lavik said. She is hoping for support from a pharmaceutical company because "ultimately, you have to think about making it commercially viable."
"We have just started having those conversations," Lavik said. "Now that we have published this paper, we hope we can generate some interest."
A critical point is convincing the U.S. Food and Drug Administration that artificial platelets would have a useful medical application, Lavik said. Convincing the FDA would start with data from future animal studies. "Assuming that it replicates what we have seen so far, then we would talk with the FDA," she said. "There is no use estimating our chance of success until we see that data and talk with them."
"Anything new that would be safe to use with someone who has ongoing hemorrhage would be useful in a trauma center," added Dr. Michael Craun, trauma medical director at Scott and White Memorial Hospital in Temple, Texas. "We really have problems now with people who have major injuries."
Another expert agreed. "Any compound or device that can stem hemorrhage in patients can be helpful if the risk-benefit ratio is favorable," said Dr. Brian Harbrecht, director of trauma at the University of Louisville.
But he and Craun also stressed the early nature of the work.
"A lot more investigation needs to go into this particular product to see if it is clinically applicable or not," Harbrecht said. "That requires years and years of more precise work."
The new report described "preliminary experiments with rats only," Craun added, and there are questions about safety, cost and technology still to be answered
Thursday, December 17, 2009
Wednesday, December 16, 2009
52 Facts About Blood Donation
1. More than 4.5 million people need blood transfusions each year in the U.S. and Canada.
2. 43,000 pints: amount of donated blood used each day in the U.S. and Canada.
3. Someone needs blood every two seconds.
4. 37% of the U.S. population is eligible to donate blood – less than 10% do annually**.
5. About 1 in 7 people entering a hospital need blood.
6. One pint of blood can save up to three lives.
7. Healthy people who are at least 17 years old (16 with parental consent), and at least 110 pounds may donate whole blood every 56 days. Females receive 53% of blood transfusions; males receive 47%.
8. 94% of blood donors are registered voters.
9. In 1901, Dr. Karl Landsteiner first identified the major human blood groups: A, B, AB and O.
10. People with O- blood are universal donors of red blood cells.
11. People with AB+ blood are universal recipients of red blood cells, and universal donors of plasma.
12. One unit of whole blood can be separated into several components, including red blood cells, plasma, and platelets.
13. Red blood cells carry oxygen to the body's organs and tissues, and live for about 120 days in the circulatory system.
14. Platelets promote blood clotting and give those with leukemia and other cancers a chance to live.
15. Plasma is a pale yellow mixture of water, proteins and salts.
16. Plasma, which is 90% water, makes up 55% of blood volume.
17. Healthy bone marrow makes a constant supply of red cells, plasma and platelets.
18. Blood or plasma that comes from people who have been paid for it cannot be used for human transfusion.
19. Granulocytes, a type of white blood cell, roll along blood vessel walls in search of bacteria to engulf and destroy.
20. White cells are the body's primary defense against infection.
21. Apheresis is a special kind of blood donation that allows a donor to give specific blood components, such as platelets or red blood cells.
22. 42 days: how long most donated red blood cells can be stored.
23. Five days: how long most donated platelets can be stored.
24. One year: how long frozen plasma can be stored.
25. Much of today's medical care depends on a steady supply of blood from healthy donors.
26. 2.7 pints: the average whole blood and red blood cell transfusion.*
27. Children being treated for cancer, premature infants and children having heart surgery may receive blood and platelets during their treatments.
28. Anemic patients may need blood transfusions to increase their red blood cell levels.
29. Cancer, transplant and trauma patients, and patients undergoing open-heart surgery may require platelet transfusions to survive.
30. Sickle cell disease is an inherited disease that affects more than 80,000 people in the U.S., 98% of whom are of African descent.
31. Many patients with severe sickle cell disease receive blood transfusions every month.
32. Over 10 tests are performed on each unit of donated blood.
33. 17% of non-donors cite "never thought about it" as the main reason for not giving blood, while 15% say they're too busy.
34. The #1 reason blood donors say they give is because they "want to help others."
35. Blood centers often run short of types O and B red blood cells.
36. There is no substitute for human blood.
37. If all blood donors gave three times a year, blood shortages would be a rare event (The current average is about two).
38. 46.5 gallons: amount of blood you could donate if you begin at age 17 and donate every 56 days until you are 79 years old.
39. There are four easy steps to donate blood: medical history, a quick physical, donation and snacks.
40. The actual blood donation takes less than 15 minutes. The entire process – from the time you sign in until the time you leave – usually takes under an hour.
41. After donating blood, you replace the fluid in hours and the red blood cells within four weeks. It takes eight weeks to restore the iron lost after donating.
42. You cannot get AIDS or any other infectious disease by donating blood.
43. 10 pints: the amount of blood in the body of an average adult.
44. One unit of whole blood is roughly the equivalent of one pint.
45. Blood makes up about 7% of your body's weight.
46. Newborn babies have about one cup of blood in their bodies.
47. Giving blood will not decrease your strength.
48. Any company, community organization, place of worship or individual may contact their local community blood center to host a blood drive.
49. Roughly half of all blood donations across the U.S. are collected at blood drives.
50. People who donate blood are volunteers and are not paid for their donation.
51. 500,000 Americans donated blood in the days following the events of September 11.
52. Blood donation. It's about an hour of your time. It's About Life!
Tuesday, December 15, 2009
Fake blood 2.0?
Posted by Bob Grant
[Entry posted at 14th December 2009 09:14 PM GMT]
View comment(1) Comment on this news story
Newly created synthetic particles that mimic red blood cells may one day carry drug molecules and/or oxygen through bloodstreams, according to researchers writing in this week's issue of the Proceedings of the National Academy of Sciences (PNAS). What's more, the team of scientists in Michigan and California say the particles could also be used to improve the resolution of magnetic resonance imaging.
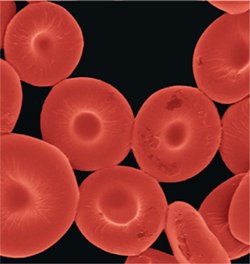
The synthetic red blood cellsthat Mitragotri and his team developedImage: Nishit Doshi"It's a very nice paper and very exciting work," Krishnendo Roy, a biomedical engineer at the University of Texas at Austin who wasn't involved with the study, told The Scientist. "The beauty of their method is its simplicity." University of California, Santa Barbara, chemical engineer Samir Mitragotri led the team of scientists and told The Scientist that the blood cell-like particles could evolve into useful tools in the clinic. "What we got very excited about was making a structure with synthetic materials that begins to mimic a natural object," said Mitragotri. "If we can bridge the gap [between synthetic materials and living cells] it will open up tremendous opportunities for synthetic materials." Mitragotri said that he and his team tested the ability of the particles to carry oxygen, finding that they had a "comparable" oxygen-carrying capacity to actual red blood cells. He added that it may be possible in the future to link therapeutic agents destined for the vascular system, such as heparin, to the particles so that they can be easily distributed throughout the blood. The artificial blood cells, with attached iron oxide nanoparticles, could also one day improve MRI resolution by serving as contrast agents that provide a different imaging signal compared to the surrounding tissue, Mitragotri said. Mitragotri and his colleagues created the artificial red blood cells by first making tiny spheres out of a biodegradable polymer called poly(lactic acid-co-glycolide) (PLGA). They then exposed the spheres to isopropanol, which collapsed them into the discoid shape characteristic of red blood cells. The researchers then layered proteins -- either albumin or hemoglobin -- onto the doughnut-shaped disks, cross-linked the proteins to give them extra strength and stability, and finally dissolved away the PLGA template to leave only a strong but flexible shell of proteins in the shape and size (about 7 microns in diameter) of a red blood cell. Mitragotri and his team then tested the ability of the artificial cells to behave like real blood cells, passing them through glass capillary tubes that were narrower than the diameter of the particles and testing their oxygen-carrying capacity. They showed that the particles could carry about 90 percent of the oxygen real red blood cells can carry. They also showed that a drug-mimicking molecule could easily be loaded into and off of the artificial blood cells. "They conclusively demonstrated some stuff concerning oxygen-carrying capacity and the potential for drug release," Patrick Doyle, a chemical engineer at the Massachusetts Institute of Technology who was not involved with the study, told The Scientist. But years of continued testing lie between Mitragotri's synthetic red blood cells and clinical application. Several questions, including how long the particles will remain in circulation, how the immune system will react to the synthetic blood cells, and how efficiently they transport oxygen, remain to be answered. Mitragotri said that his lab plans on answering these questions by studying the particles in model organisms, research that is set to begin soon. "Whether this is applicable in an in vivo setting," said Roy, "we won't know that for 3, 4, or 5 years." "I don't think these [clinical applications] are far off ideas, but you have to go through all the usual regulatory hurdles," said Doyle, noting that the synthetic cells might also be used to study how cellular aberrations, such as tumor cells, behave in the body. "Ultimately they can also be model systems, by which you can understand disease states of cells," he added.
Friday, October 23, 2009
Oswald Hope Robertson
Jump to: navigation, search
Oswald Hope Robertson (2 June 1886 – 23 March 1966) was an English-born medical scientist who pioneered the idea of blood banks in the "blood depots" he established in 1917 during service in France with the US Army Medical Corps.
Robertson was born in Woolwich in south-east London, but at the age of one-and-a-half he emigrated with his parents to California, settling in the San Joaquin Valley. He attended local schools in Dinuba, then graduated from the Polytechnic High School in San Francisco.
His initial plan to study basic biology was changed by a meeting with an American medical student while on holiday in Germany. After attending some lectures on anatomy, he decided to study medicine, being admitted to the University of California in 1906. He later studied at Harvard Medical School, the Massachusetts General Hospital and the Rockefeller Institute for Medical Research, but had to cut short his studies during World War I when he was called to join medical teams in France. Here he experimented with preserving human blood cells for use in blood transfusions, and became recognised as the inventor of the blood bank.
[edit] Commemoration
Thursday, April 23, 2009
Conslusion
As already seen in the discussion part, the hypothesis which expressed there is no relationship between activation/inhibition of the platelets and externalization the phosphatidylserine would be, based on the results, ruled out.
Another hypothesis which expresses the relation ship is still on the table. It is not possible to declare:
-Activation of the platelets by Thrombin causes externalization of phosphatidylserine on the surface of the platelets.
-In this experiment the same results could be not applied to ADP as the test was performed for different concentrations of ADP but satisfactory results were not reached. Changing method in this regard in suggested.
-Inhibition of the platelets by Aspirin causes internalization of phosphatidylserine on the surface of the platelets. This statement has been approved by comparing the results of controls with and with out Aspirin.
In addition, having seen the papers, we would realize that COHEN Zoë and colleagues conducted a research in 2004 and their find out declare that if platelets become activated, they would express phosphatidylserine on the outer leaflet of the plasma membrane. They have working with ADP as they say ADP-induced PS exposure. They wanted to realise the role of Caspase in this process as well, while we were not. It can be a suggestion for further works as well to consider different enzymes in this process. Their findings could be useful to prove the activatory role of ADP as well.
Finally, the characteristics of Annexin V have been approved again. The property which they bind with negatively charged phospholipid on the surface of the cells, although it is not the main statement of this experiment but this viable facts could be used to be applied in other experiments as well.
6.1. Suggestions for further works
It should be realised how Thrombin/ADP or Aspirin apply their changes on the platelets. If we were working on cells which have nuclei the possibility of effect on the nuclei could be mentioned. But the platelets which are circulating in blood are not same cell. Therefore changing the expression of a gene which is highly possible for physiological reactions is ruled out. The other and simple way which comes to mind is acting by the aid of a second messenger. Further studies should be based on understanding the mechanism of this effect.
Repeating this experiment with different activators is suggested as well, in particular due to unclear results from ADP.
Further experiments should investigate about the role of Caspase and try to find out the mechanism of inhibition and activation with more details.
As stated about the receptors of ADP and Thrombin. The mechanism of action of stimulation (activation or inhibition) should be considered to find more relationship between the factor of change and response.
Subscribe to:
Posts (Atom)